10 Apr Top 5 Startup Metrics to Show Traction (2019)
Have you ever been asked for your traction as a company? Whether it be for your upcoming board meeting or to appease potential investors; Five23 has identified five startup metrics that will give you that needed boost and show your startup’s traction. Not only will they give you a good idea of how your company is growing overtime, but they will also show you actionable items which could lead to improvement.
EBITDA Margin
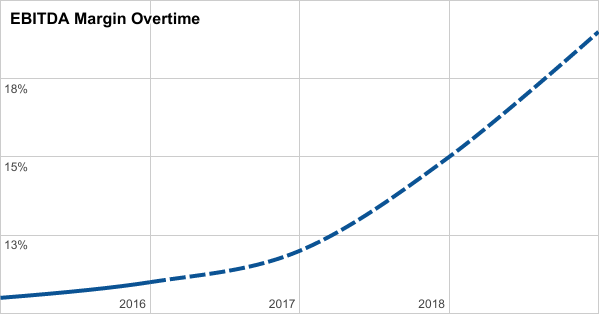
EBITDA Margin is a measurement of a startup’s operating profitability as a percentage of its total revenue. Calculating a startup’s EBITDA Margin is done by equalling the total EBITDA (earnings before interest, tax, depreciation and amortization) divided by the total revenue. The higher the EBITDA Margin of a startup, the smaller the startup’s operating expenses are in relation to the total revenue of the company. This is a strong tool used by investors to show how profitable the company is as well as how lean the venture operates in comparison to their revenue. Keep in mind, the average product based company has an EBITDA Margin of roughly 12%, while the average service based company has an EBITDA Margin of roughly 18%.

Monthly Recurring Revenue (MRR)
Monthly Recurring Revenue is the proof of the pudding in your business model. While not all business models have recurring revenue on a monthly basis, it does show potential investors how profitable the company can becomes overtime for subscription based businesses. Once a client is subscribed to the service or software, that revenue can be relied upon each month. It should be noted there are secondary metrics which accompany MRR, such as customer retention and churn, using this metric can show how strong the company can be from a financial standpoint each month. This metric is very predictable and reliable, which investors take comfort in.
Customer Acquisition Cost (CAC)
Customer Acquisition Cost refers to the resources a business must spend in order to acquire more customers. Whether it be financial spending or otherwise, this metric includes every effort necessary to introduce your products and services to potential customers. Common expenses in this metric may include: staffing salaries of sales and marketing employees, CRM software, marketing automation, paid advertisements, sponsorships, events and many other items which may have direct contact with the targeted individuals. Investors look at the ‘Customer Acquistion Cost’ of the startup to better judge the overall expenses of the startup overtime. As the business grows, the cost this metric shows should reduce in size. If this cost increases, it shows an investor the startup is unprofitable in the long run.
Customer Lifetime Value (CLV)
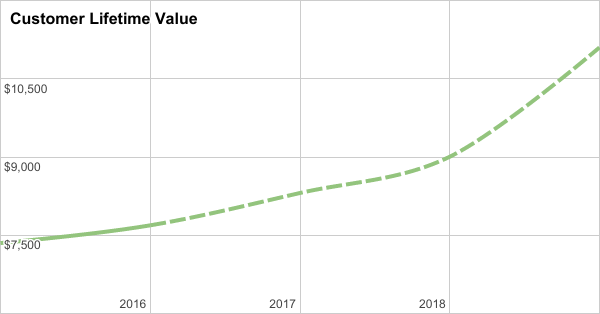
Customer Lifetime Value is a metric used to measure the revenue your business or startup receives from any given customer. The purpose is to see the overall amount of financial assets spent using your service or purchasing your product on a customer by customer level. When used properly, it can help businesses define the correct amount of CAC needed for the service or product. When calculated, it may also improve the overall accuracy of allocating funds in terms of customer retention and sales. Investors use the CLV metric in a variety of ways, however, the majority of them refer to the total addressable market of the startup and the CAC.

Month-Over-Month Growth (MOM)
Month-Over-Month Growth is a metric used to express changes in levels in respect the previous month. While this metric can be used to define growth in many different aspects of the company. Generally it is used to define the growth of the startup financially, and from a market viewpoint. In many service based companies, the MOM metric is for the total amount of customers. With product based companies, the MOM metric is used for the total amount of products purchased. Investors use this metric to judge the overall health of the startup and growth trends.

